Catch regressions. Report them in one click.
Compare a page with its baseline pixel by pixel, scan a whole site on every screen, find broken links, and hand over a report or a ready-to-file issue.
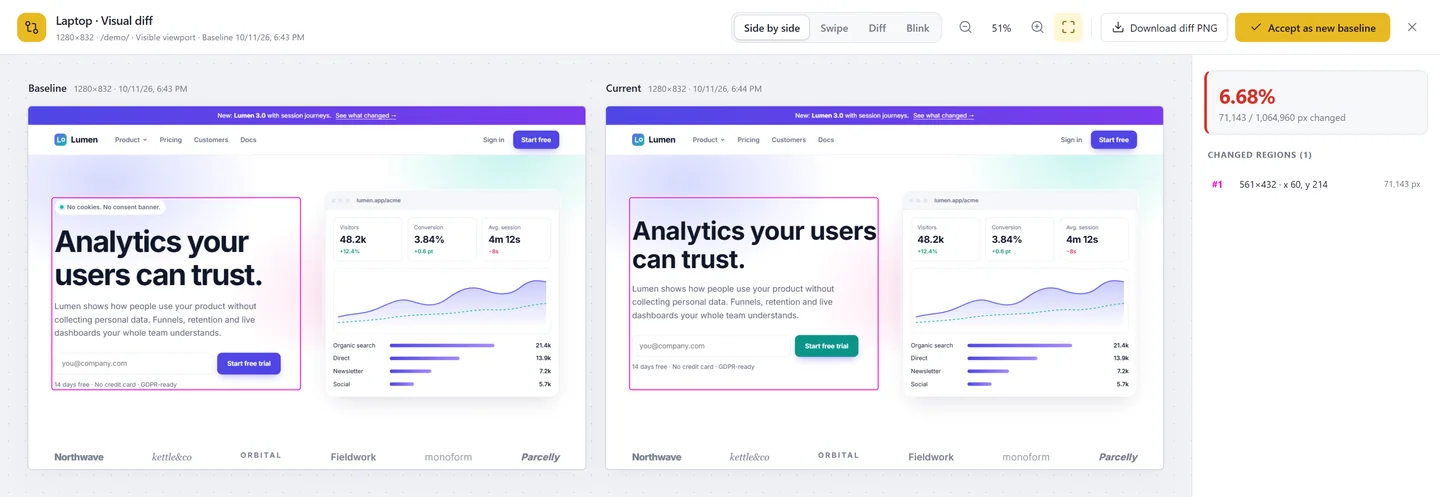
Responsive check
Horizontal overflow, tap targets under 24 or 44 px, text under 12 px, images too small for the pixel ratio and a missing viewport meta, outlined on each screen.
- Runs on all screens
- Export as an HTML report
- Overflow shown in the status bar
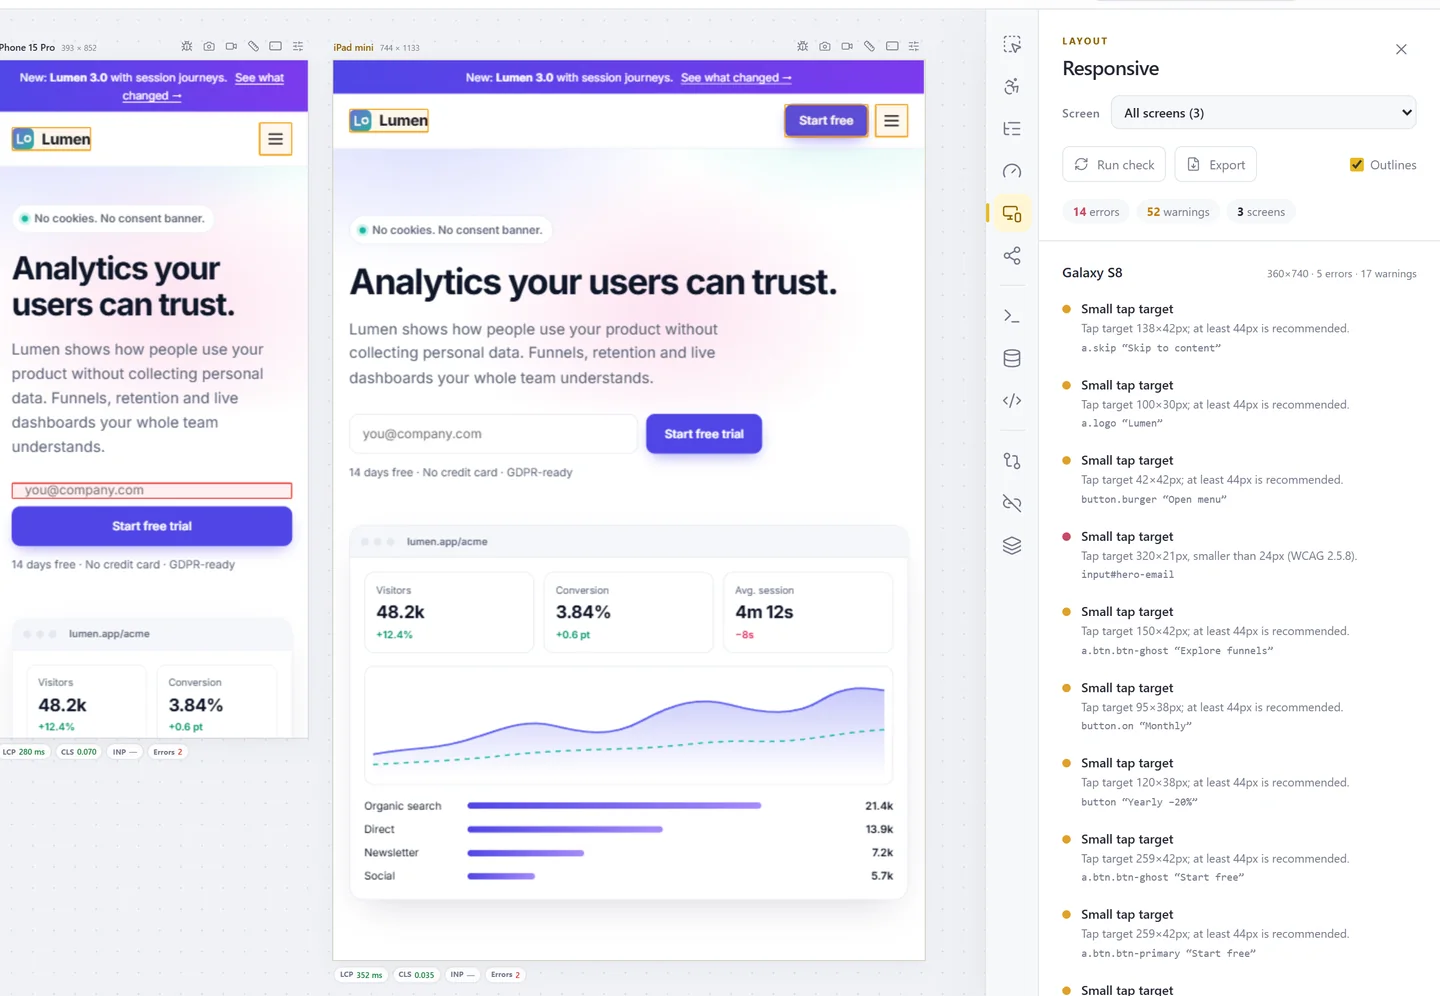
Visual diff
Save a baseline per screen and page, change your code, compare. Anti-aliasing is ignored, changed regions are listed, and you can accept the new version as the baseline.
- Side by side, swipe, diff and blink views
- Change percentage in the status bar
- Baselines stored locally (IndexedDB)
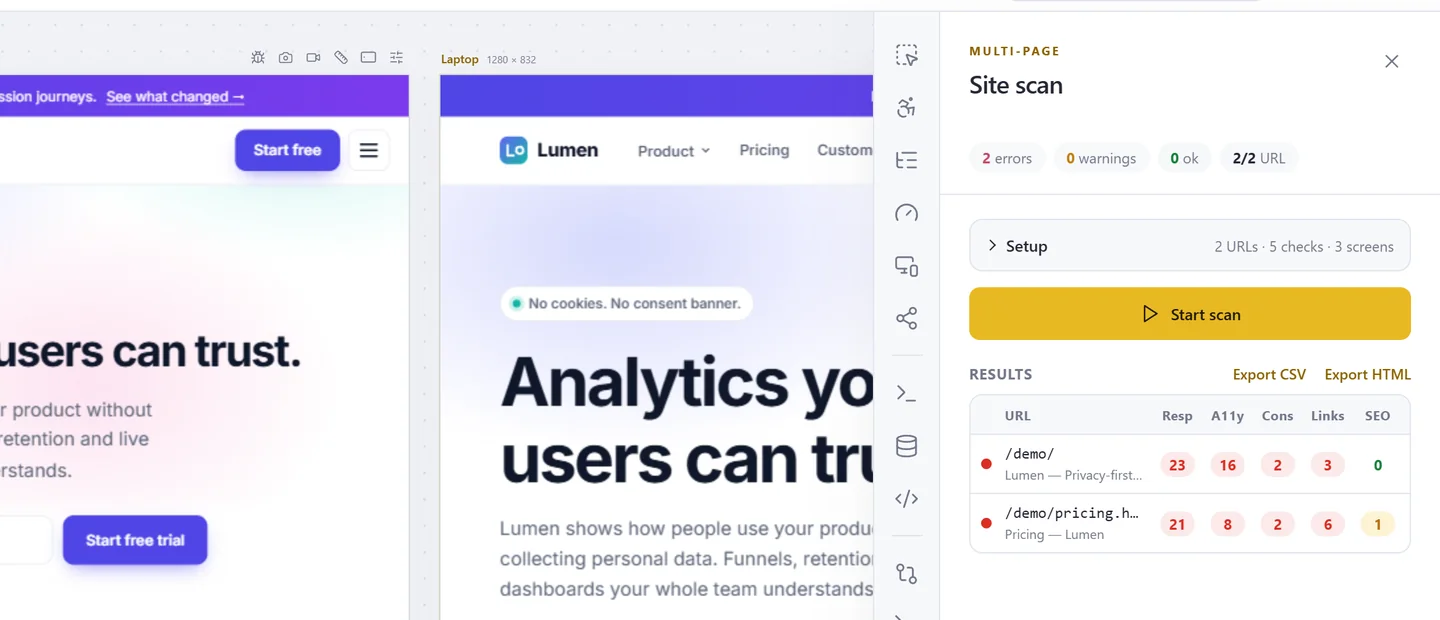
Site scan
A list of URLs, your sitemap.xml or a crawl from the current page, checked on every screen: responsive, accessibility, console errors, broken links and basic SEO.
- Results per page and check
- Export CSV or HTML
- Open any page in the screens
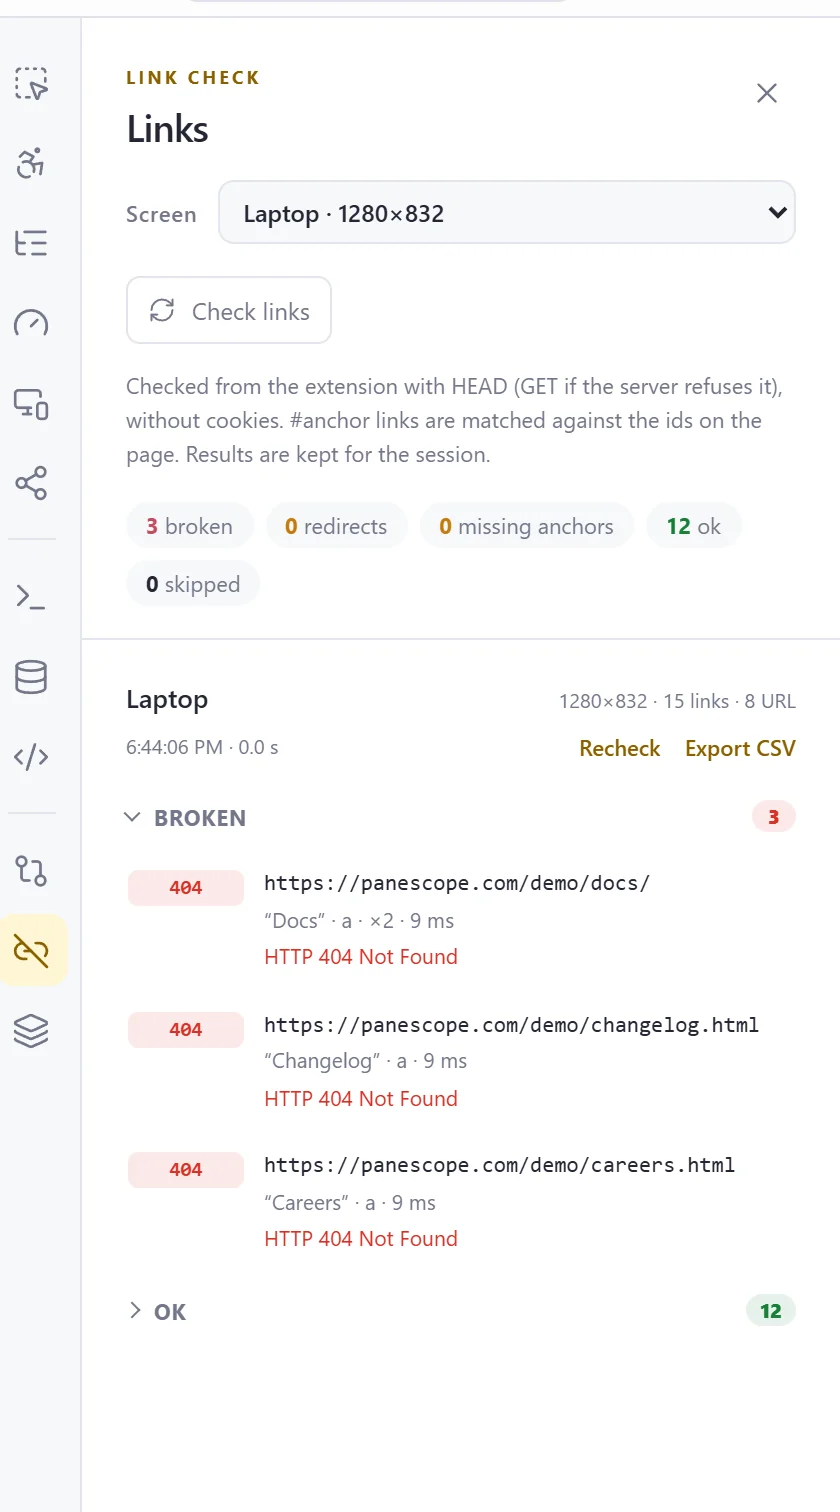
Broken links
Every link, image, stylesheet, script, iframe and #anchor of a screen, checked with HEAD then GET, six at a time.
- Status code for every resource
- Missing #anchors found too
A report your client can open
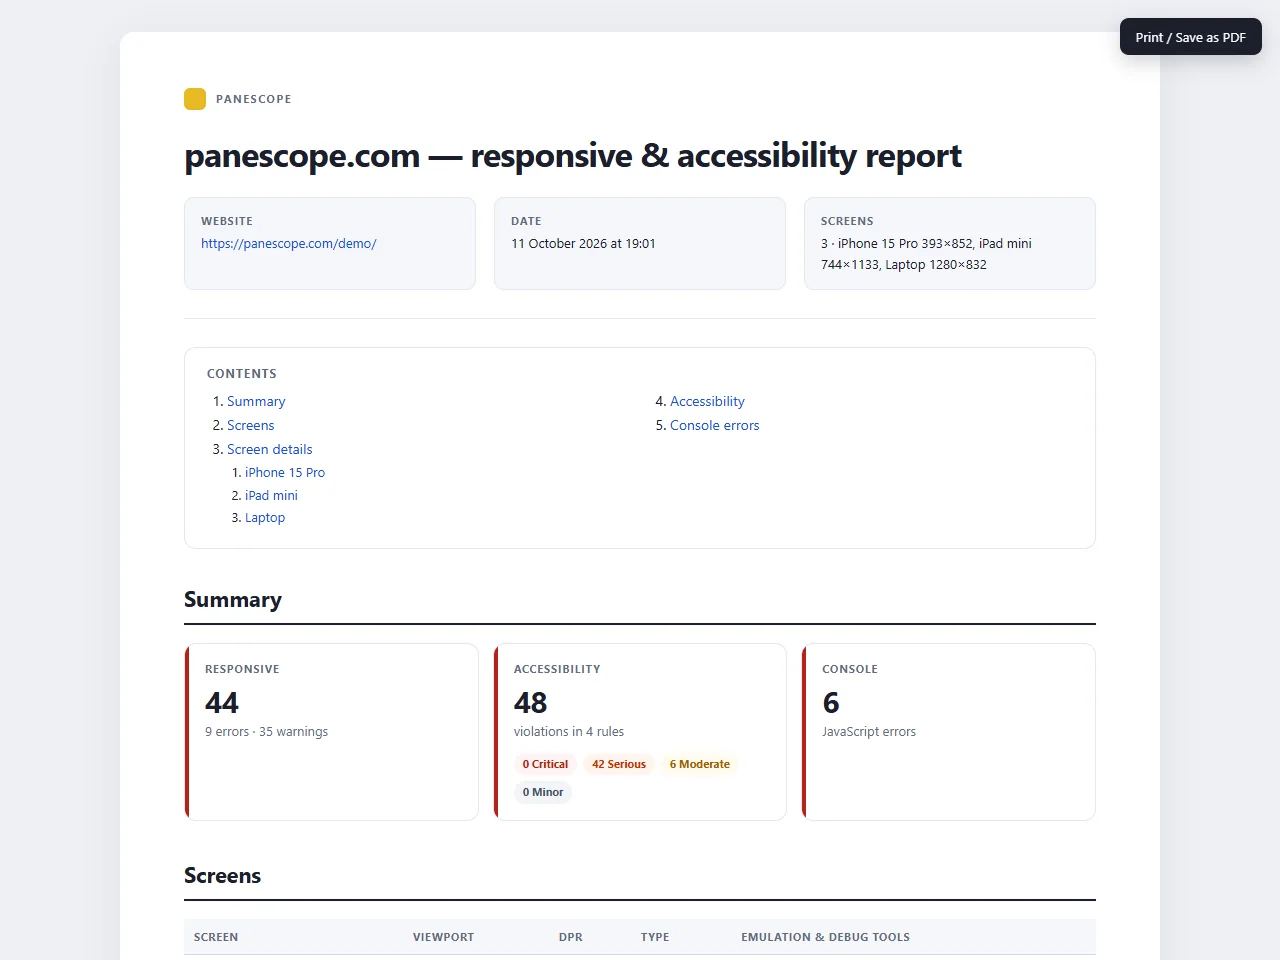
One self-contained HTML file with screenshots of every screen, scores, responsive and accessibility findings, Web Vitals, console errors, visual diffs and meta. Prints to A4 PDF.
- Choose the sections and the screenshot size
- Table of contents and summary
- No account needed to open it
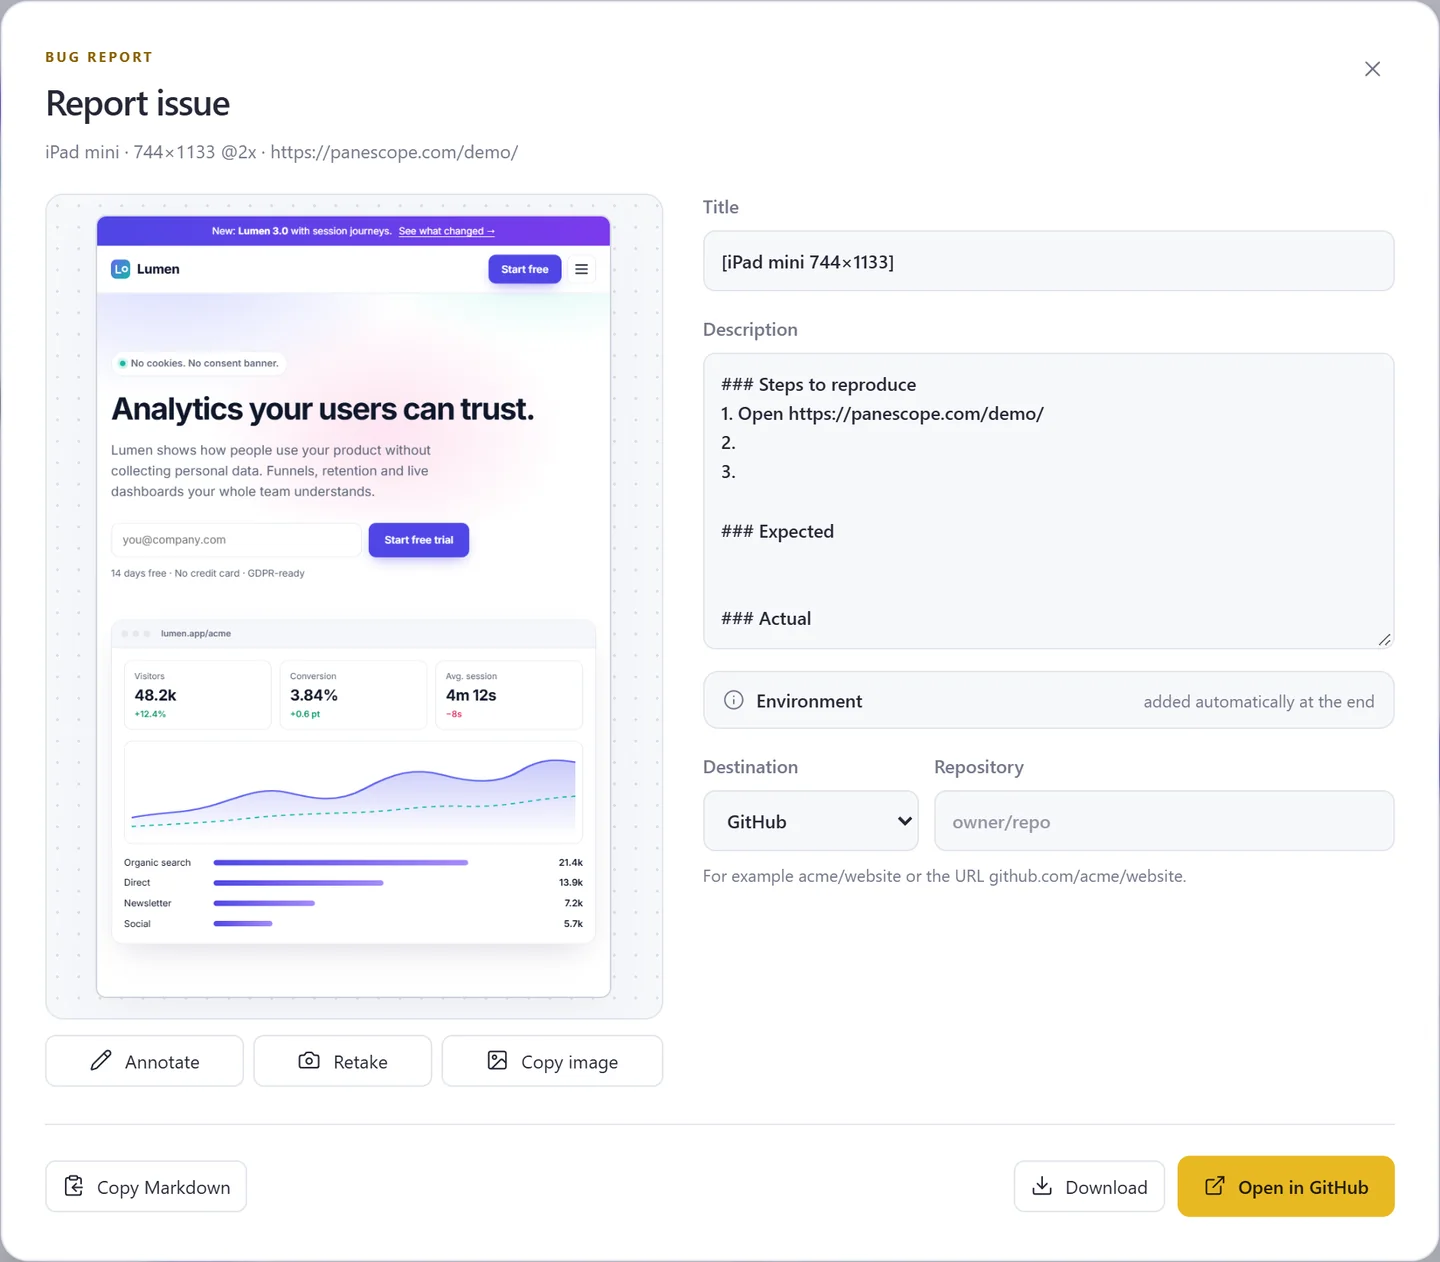
Report issue
Right-click a screen: Panescope takes a screenshot (annotate it if you like) and writes the Markdown with the environment: URL, device, viewport, DPR, emulation and console errors. Open it in GitHub, GitLab, Linear or Jira.
- Screenshot copied to paste into the issue
- Environment added automatically
Test every screen before your users do.
Free to start. Pro for 3 days without a card.