Core Web Vitals on every screen, next to real-user data.
LCP, INP, CLS, FCP and TTFB measured inside each screen, with the LCP element and the layout shifts outlined. Compare them with what real Chrome users see.
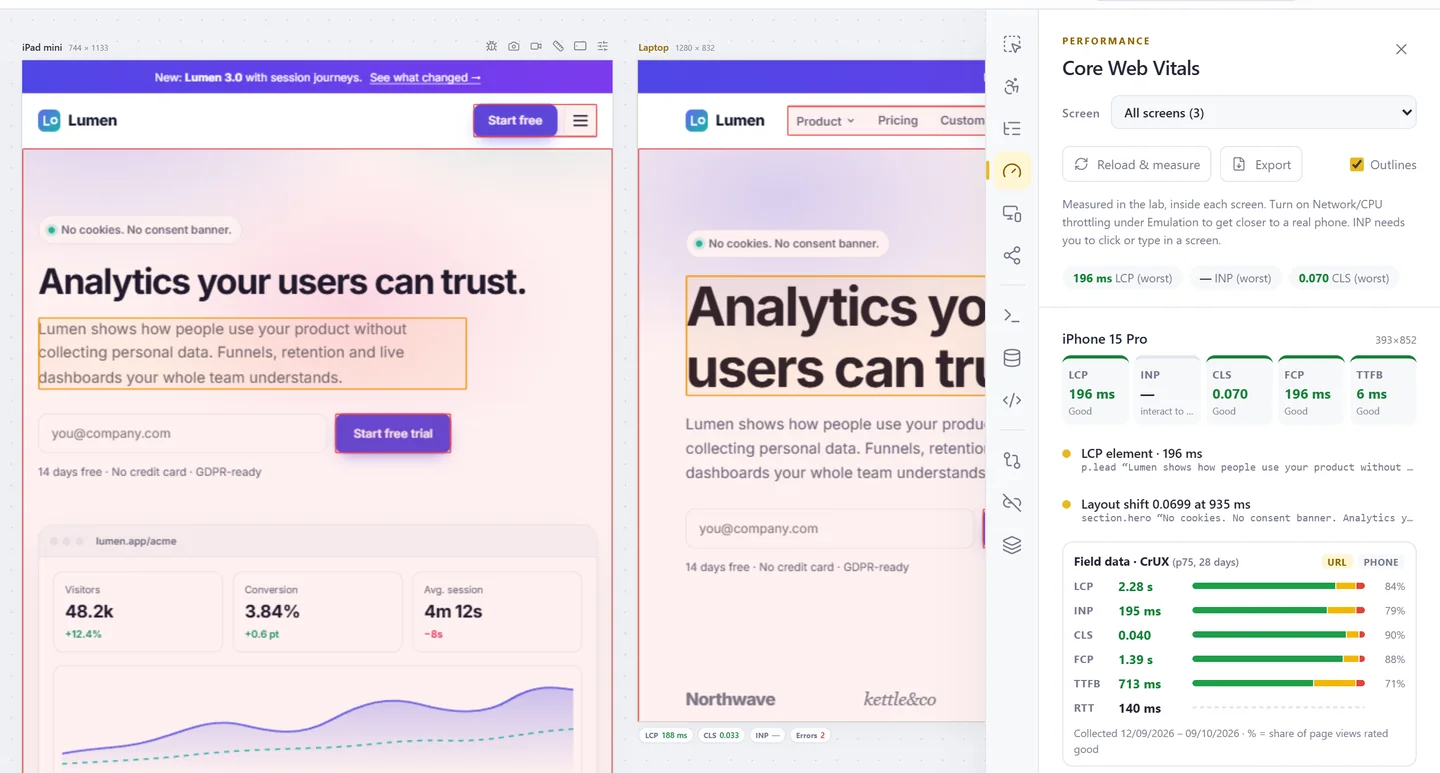
Lab metrics where the layout happens
A phone layout loads a different hero image than a laptop. Panescope reloads each screen and measures it the way the web-vitals library does, so you see the difference.
- LCP, INP, CLS, FCP and TTFB per screen
- LCP element and layout-shift sources highlighted
- INP updates live as you click and type
- Network and CPU throttling under Emulation
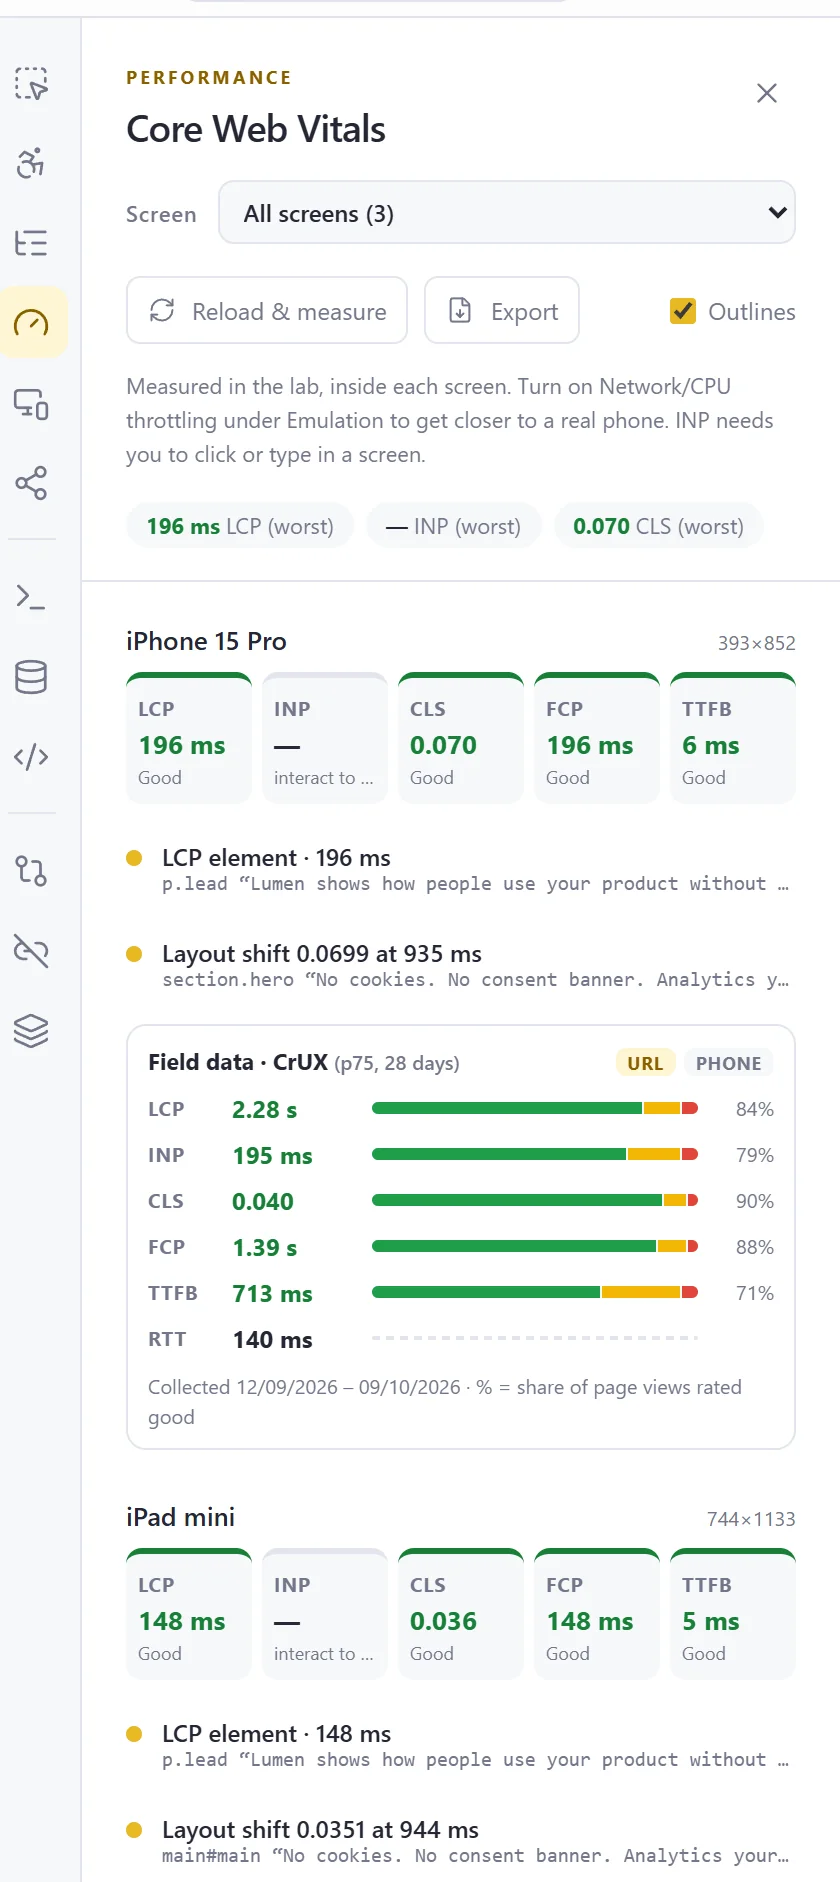
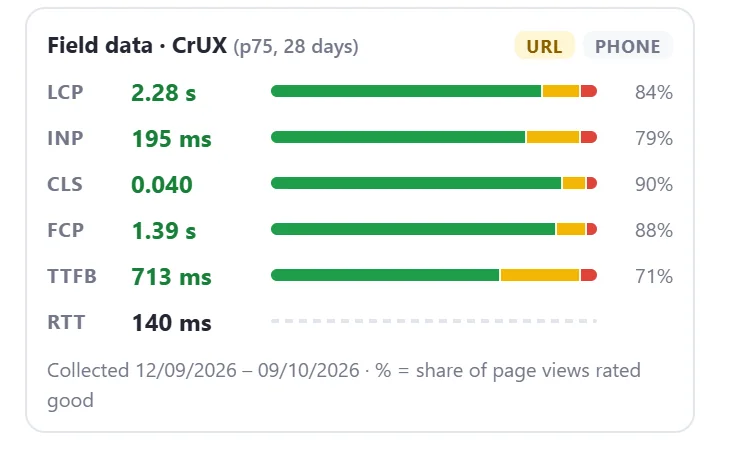
CrUX field data beside the lab
The Chrome UX Report has 28 days of real-user data for public pages. Panescope shows its 75th percentile and the good / needs-improvement / poor split for phone, tablet and desktop.
- URL data, or the origin when the URL has none
- Included with Pro, no API key needed
- Or use your own API key
A status bar under every screen
LCP, CLS, INP, console errors, horizontal overflow, accessibility violations and active debug tools, always in sight. Click a chip to open the details for that screen.
- Turns amber or red when a value is poor
- One click to the matching panel

Also in Performance
Network throttling
Fast 4G, slow 4G, 3G or offline, per screen.
CPU throttling
Slow the processor down for the whole workspace, like a mid-range phone.
Responsive check
Horizontal overflow, small tap targets, tiny text, low-resolution images and the viewport meta.
Test every screen before your users do.
Free to start. Pro for 3 days without a card.